An object's position is described by the following polynomial for 0 to 10 s…
s = t3 − 15t2 + 54t
where s is in meters, t is in seconds, and positive is forward. Determine…
the object's velocity as a function of time
the object's acceleration as a function of time
the object's maximum velocity
the object's minimum velocity
the time when the object was moving backward
the times when the object returned to its starting position
the object's average velocity
the object's average speed
The graph below shows the acceleration of a hydraulic elevator in a four story school building as a function of time.
The graph begins at t = 0 s when the elevator door closed on the second floor and ends at t = 20 s when the door opened on a different floor. Assume that the positive directions for displacement, velocity, and acceleration are upward. Determine…
the maximum speed of the elevator
the duration of the brief jerk experienced by the elevator centered on 17.5 s
Sketch the corresponding graphs of…
velocity-time
position-time
Determine…
the most likely floor on which the elevator stopped
youtu.be/R1g07RpTPFEOne fine day on an unused airport runway, a high-end sports car conducted a 0 to 400 km/h performance test. Its velocity changed according to the following function…
v = a(1 − e−t/b)
where…
a =
128.1 m/s
b =
13.31 s
Answer these three related questions.
How long did it take the car to reach 400 km/h (111.111 m/s)?
What was its average acceleration during the test?
What is the car's theoretical top speed?
Answer these three related questions.
Derive an expression for acceleration as a function of time.
What was the acceleration of the car when the test started?
What was the acceleration of the car when it hit 400 km/h?
Answer these two related questions.
Derive an expression for displacement as a function of time.
What distance did the car travel while accelerating?
After reaching the target speed of 400 km/h (111.111 m/s), the driver immediately disengaged the engine and applied the brakes. The car came to a complete stop after 9.451 s. Answer these three related questions.
What was the average acceleration of the car while stopping?
What distance did the car travel while stopping?
What total distance did the car travel from start to finish?
algebraic
Determine the acceleration-velocity relationship for constant jerk. (For the sake of argument, let's call this the fifth equation of motion.)
calculus
An object's velocity, v, in meters per second is described by the following function of time, t, in seconds for a substantial length of time…
v = 4t(4 − t) + 8
Assuming the object is located at the origin (s = 0 m) when t = 0 s determine…
the object's position, s, as a function of time
the object's acceleration, a, as a function of time
the object's maximum velocity
if and when when the object stops
if and when the object returns to the origin (s = 0 m)
The following equations state displacement as a function of time. Derive the subsequent equations for velocity and acceleration as functions of time. (The symbols A, f, j, k, s0, π and τ are all constants.)
s = ⅙jt3
s = A sin(2πft)
s = s0e−t/τ
A crude mathematical model of tunneling is represented by the equation…
v =
k
s
where v is the tunneling speed; s is the length of the tunnel; and k is a constant.
In what way (increase or decrease) does the tunneling speed change as the tunnel gets longer? What engineering aspect of tunneling is causing this change?
Determine the following quantities as a function of time…
tunnel length
tunneling speed
tunneling acceleration
(This is a somewhat difficult problem for students who have just started learning calculus.)
A simplified model of a car accelerating from rest along a straight path is given by the following equation…
v(t) = a(1 − e−bt)
Where v(t) is the instantaneous speed of the car in feet per second, t is the time in seconds, and A and b are constants.
speed
What are the units in the coefficients a and b?
What is the physical meaning of the coefficent a?
What is the speed of the car at t = 0 s?
What is the asymptote of this function as t → ∞?
Sketch a graph of speed vs. time. Include the value of v(0 s) and the asymptote of v as t → ∞.
position
Derive an equation s(t) for the instantaneous position of the car as a function of time. (Be sure that your function has the value s = 0 m when t = 0 s.)
What is the asymptote of this function as t → ∞?
What is the physical meaning of the slope of this asymptote?
Sketch a graph of position vs. time. Include the value of s(0 s) and the slope of the asymptote of s as t → ∞.
acceleration
Derive an equation a(t) for the instantaneous acceleration of the car as a function of time.
What is the acceleration of the car at t = 0 s?
What is the asymptote of this function as t → ∞?
Sketch a graph of acceleration vs. time. Include the value of a(0 s) and the asymptote of a as t → ∞.
youtu.be/9eH837Fh1Oo
Apply this model to a real but exceptional car — the Red Victor 1. This car has a zero-to-sixty time of about one second and a quarter mile time of about eight seconds. In other words, let…
v(1 sec) =
88 ft/sec
s(8 sec) =
1320 ft
then determine…
the values of the coefficients a and b [I think this can only be done using a fancy calculator.]
the maximum speed, and
the maximum acceleration.
An object's position is described by the following polynomial for 10 s…
s = t3 − 12t2 + 24t
where s is in meters and t is in seconds.
Determine…
the object's velocity as a function of time
the object's acceleration as a function of time
the object's maximum velocity
the object's minimum velocity
the time when the object was moving backward
the time(s) when the object was at the origin (s = 0 m)
the time(s) when the object returned to its starting position
the object's average velocity
the object's average speed
statistical
elevator.txt The acceleration-time data in the accompanying text file were recorded by a student while riding an elevator in an office building. The student went from the lobby to the highest occupied floor. Use this data and your favorite graphing application to solve the following problems.
Velocity
Construct a velocity-time graph.
Detemine the cruising speed of the elevator.
Displacement
Construct a displacement-time graph.
Determine the height of the building.
Estimate the number of floors in the building.
table-splits.shtml A split is a time at which the runner reaches a milestone distance in a race. In the 100 m dash, for example, split times are taken every 10 m. Splits for some of the world's fastest sprinters of the late 20th century are given on the accompanying webpage. Fit a high order polynomial (fourth, fifth, sixth, or higher) to the data for one of these athletes using the data analysis application of your choice. Determine the speed of your sprinter as a function of time by taking the derivative of this polynomial. Graph this new function and then analyze it.
What were the runner's initial and final speeds?
What was the runner's maximum speed and when did it occur?
What was the runner's average speed?
Did the runner's speed increase, decrease, or remain roughly the same near the end of the race?
Comment on your results. How well do you think this graph describes the actual performance of the runner? Are there any problem regions on the graph? How could the function be modified to improve the fit?
table-timeslips.shtml Amateur drag racing is open to anyone with a street legal vehicle (car, light truck, or motorcycle), a valid driver's license, insurance, fuel, and enough money to cover the registration fee. It is popular in the US, UK, and Australia. Races are done on a quarter mile, straight, level track. At the end of the race, each competitor is given a small paper "time slip" with data collected during the run. Data vary from venue to venue, but the following items are almost always present.
Reaction time (R/T) is the time between the signal to start and when the driver actually makes the car move forward.
Elapsed times (ET) are splits recorded at several positions. Elapsed time begins when the car crosses the starting line, not when the signal to start is given (as is done in track and field).
Instantaneous speeds are measured at the ⅛ mile (halfway) and ¼ mile (finish). We won't use these number for this activity.
The webpage that accompanies this problem has links to images of 50 different time slips — a sampling of the thousands compiled by enthusiasts at dragtimes.com.
Select one times slip and transfer the information into a table like the one below.
Add reaction time to elapsed time to get race time. (I made up that term. I don't know what it's actually called.)
Drag racing time slip raw data
distance
left car time (s)
right car time (s)
(feet)
(miles)
(m)
elapsed
race
elapsed
race
0000
0
000
0
0
0060
-
018
0330
-
101
0660
⅛
201
1000
-
305
1320
¼
402
Plot the distance-time data for each car. (Make two graphs.)
Perform the following curve fits on each graph…
linear
quadratic
cubic
Complete the following table. Be sure to include the proper units in your answers. Because you did three different curve fits, some quantities can be found by more than one method. Under "methodology" state which function (linear, quadratic, cubic), which coefficient (t0, t1, t2, t3), how much scaling (× 2, × 3, × 4, …, ÷ 2, ÷ 3, ÷ 4, … ) it took to get your answer.
Drag Racing Time Slip — Analysis
quantity
methodology
left car
right car
average speed
initial speed
average acceleration
initial acceleration
average jerk
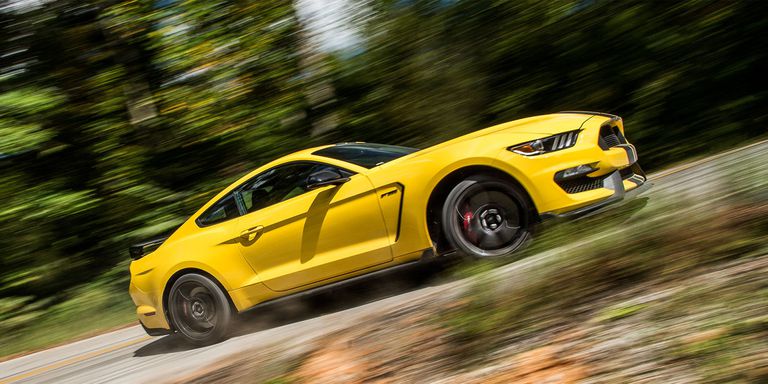
mustang.txt In 2016 Road & Track magazine tested eight very expensive and very fast cars to determine the Performance Car of the Year. Data from an acceleration test for a 2016 Ford Mustang Shelby GT350R are given in the accompanying tab-delimited text file. (The Mustang did not win the award that year.) Since the data were collected in the United States, the milestone speeds were chosen as multiples of 10 mph. For your convenience, these speeds were converted to SI units.
Using your favorite application for analyzing data, make a scatter plot of speed (in meter per second) vs. time (in seconds) and add an appropriate best fit curve.
Use the results of your curve fit and your knowledge of calculus to create the equations for…
acceleration as a function of time
displacement as a function of time
During this test…
did the distance traveled by the car increase, decrease, or remain the same?
did the speed of the car increase, decrease, or remain the same?
did the acceleration of the car increase, decrease, or remain the same?
zarm-kinematics.txt The data in the accompanying tab delimited text file give the instantaneous velocity of a vertically mounted piston used to launch projectiles as a function of time. Use this data set and your favorite application for analyzing data to solve the following problems.
Using the data given, create a velocity-time graph and determine…
the maximum velocity and
the average velocity of the piston while it was accelerating upward
Determine the acceleration of the piston as a function of time, create an acceleration-time graph, and determine…
the maximum acceleration and
the average acceleration of the piston while it was accelerating upward
Determine the displacement of the piston as a function of time, create a displacement-time graph, and determine…
the final displacement of the piston once it stopped moving
nyct-bus.txt The tab separated variable file above gives acceleration-time performance standards that the New York City Transit Authority, Department of Buses gives to prospective vendors. If you want to sell a bus to the city it needs to pull away from a stop with accelerations that match these numbers to within ±10%. Using the data in this file and your favorite data analysis application, create the corresponding…
acceleration-time graph
speed-time graph
distance-time graph
Note: You have probably done this correctly if you end up with a final speed of about 21 m/s (47 mph) and a final distance of about 380 m (1300 feet).