bb-tungsten.txt A tungsten filament, incandescent light bulb. For extra credit, determine the surface area of the light bulb's filament given a power output of 15 W.
bb-daylight.txt The Sun. Daylight is almost the same spectrum as sunlight, but it's less likely to burn out your spectrometer. For extra credit, determine the luminosity of the Sun (its radiant power).
solution
Temperature comes from Wien's displacement law.
T =
b
⇐
λmax =
b
λmax
T
Heat flow rate and surface area are related by the Stefan-Boltzmann law.
A =
P
⇐
P = εσAT4
εσT4
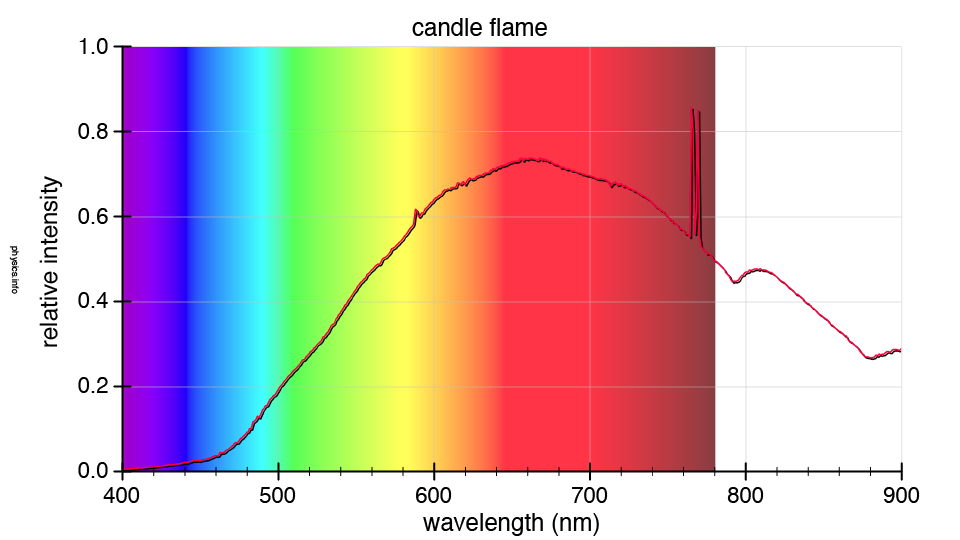
The two spikes in the deep red are probably the glowing tip of the burning wick, not the flame alone. The peak wavelength (disregarding the spikes) appears to be in the red at 655 nm (0.655 μm).
T =
b
λmax
T =
2898 μm K
0.655 μm
T = 4400 K
This seems a litle hot for a candle flame, but not unreasonably so.
The peak wavelength for the traditional light bulb appears to be in the orange at 615 nm (0.615 μm).
T =
b
λmax
T =
2898 μm K
0.615 μm
T = 4700 K
This seems a little hot for an incandescent light bulb, but like the candle flame it's not that far off.
Use the Stefan-Boltzmann law to determine the area of the filament. Assume the filament is an ideal radiator and ignore room temperature (about 300 K). All of these calculations are going to be pretty crude by necessity.
A =
P
εσT4
A =
15 W
(1)(5.67 × 10⁻⁸ W/m2K4)(4700 K)4
A = 5.4 × 10⁻⁷ m2
Light bulb filaments are pretty tiny, so this number doesn't look wrong.
This spectrum appears to peak at the green wavelength of 545 nm (0.545 μm).
T =
b
λmax
T =
2898 μm K
0.545 μm
T = 5300 K
This value is reasonably close to the nominal surface temperature of the Sun — 5772 K.
Use the Stefan-Boltzmann law to determine the power of the Sun. Assume the Sun is an ideal radiator and ignore the temperature of empty space (about 3 K). It doesn't have much of an effect in this case. Use the radius of the Sun to get its surface area.
This value is correct within an order of magnitude of the nominal solar luminosity — 3.828 × 1026 W.
practice problem 2
Dyson sphere
Given a Dyson sphere as big as the Earth's orbit surrounding the Sun, determine…
its surface temperature and
the peak wavelength of the radiation emitted.
Given a Dyson sphere with an interior temperature suitable for human habitation surrounding the Sun, determine…
its radius and
the peak wavelength of the radiation emitted.
Given a Dyson sphere with an interior temperature suitable for human habitation and a surface gravity equal to 1 g surrounding a white dwarf star with the mass of the Sun and the radius of the Earth, determine…
the Dyson sphere's radius and
the surface temperature of the white dwarf.
solution
A Dyson sphere the size of Earth's orbit
Once equilibrium has been reached, a Dyson sphere will radiate energy at the same rate as the star it surrounds. Assume that both the sphere and the star are blackbody radiators. Using Stefan's law it can be shown that the temperature of a Dyson sphere is inversely proportional to the square root of its radius.
P =
Q
= constant
t
σεDSADSTDS4
=
σεsunAsunTsun4
σεDS4πrDS2TDS4
=
σεsun4πrsun2Tsun4
TDS
=
⎛ ⎜ ⎝
rsun
⎞½ ⎟ ⎠
Tsun
rDS
Using the physical data for the Sun and Earth we can now determine the sphere's surface temperature
This is beyond uncomfortable. The interior would be 20 °C hotter than the normal boiling point of water. It would kill people, their pets, their crops, and all other forms of life outside a few hearty bacteria or archaea. Building a megastructure like this as a home for non-sentient extremophiles would be a waste of resources to say the least.
The peak wavelength of the thermal radiation emitted comes from Wien's displacement law.
λmax =
b
T
λmax =
2898 μm K
394 K
λmax =
7.36 μm = 7360 nm
No surprise here, the peak would lie in the infrared region of the electromagnetic spectrum. Had an alien civilization built a Dyson sphere with these dimensions, it would emit characteristic blackbody radiation with a peak wavelength of 7360 nm.
A more comfortable Dyson sphere
A Dyson sphere of the first type would be uninhabitable. A more comfortable temperature would have an interior temperature about 300 K (27 °C) — a number that physicists like to use as an easy approximation of room temperature. Were an advanced human civilization to build such a structure, it would have to be larger than the orbit of the Earth.
P =
Q
= constant
t
σεDSADSTDS4
=
σεsunAsunTsun4
σεDS4πrDS2TDS4
=
σεsun4πrsun2Tsun4
rDS
=
⎛ ⎜ ⎝
Tsun
⎞2 ⎟ ⎠
rsun
TDS
Substitute appropriate numbers for the Sun and Earth.
This is a bit bigger than the orbit of Mars (which is 1.52 astronomical units). The temperature inside would be fine, but the increased distance to the Sun would make it seem a bit dim. Keep in mind that this is a sun that would never set.
Using Wien's law, we again find a peak wavelength in the infrared.
λmax =
b
T
λmax =
2898 μm K
300 K
λmax =
9.66 μm = 9660 nm
A Dyson sphere with heated floors and natural gravity
This part is a question about Newton's law of universal gravitation, not thermodynamics. What distance from the Sun would give us standard Earth gravity?
This is much closer to our white dwarf star than Mercury is to our Sun (0.39 au) but not as close as the Moon is to the Earth (60 Earth radii). A Dyson sphere of this size would be much easier to build than the others described in this problem.
Use Stefan's law one more time.
P =
Q
= constant
t
σεDSADSTDS4
=
σεwdAwdTwd4
σεDS4πrDS2TDS4
=
σεwd4πrwd2Twd4
Twd
=
⎛ ⎜ ⎝
rDS
⎞ ⎟ ⎠
½
TDS
rwd
This time solve it for temperature on the surface of the white dwarf.
Twd
=
⎛ ⎜ ⎝
3.68 × 10⁹ m
⎞½ ⎟ ⎠
300 K
6.37 × 10⁶ m
Twd = 7210 K
Our Sun is fated to become a white dwarf sometime in after 5 billion years. It's initial surface temperature would be much hotter than 7210 kelvin. Give it maybe another 5 billion years for it to cool down. If humans haven't gone extinct or migrated to other parts of the galaxy by then and if their technological needs and capabilities were sufficiently advanced, a Dyson sphere of this type might be the way to power a future supercivilization.
practice problem 3
This problem is about the greenhouse effect on the Earth. Determine…
the irradiance of the Sun at the Earth
the effective solar irradiance absorbed by the Earth
the surface temperature of the Earth if there was no atmosphere
The irradiance of the Sun at the Earth is also known as the solar constant. The solar constant for the Earth is found by dividing the Sun's luminosity by the surface area of an imaginary sphere the size of Earth's orbit.
One half of the Earth is exposed of the Sun at any moment, but because the Earth rotates and revolves, every part of it is eventually exposed. The Suns' energy is collected in a circle but spread across a sphere. This reduces the effective irradiance by one fourth. I propose this be called the "rotisserie effect" in the US since it reminds me of supermarket rotisserie chickens. In Greece it shall be called the "gyros effect" (αποτέλεσμα γύρος), in Lebanon the "shawarma effect" (تأثير الشاورما), and in England the "spit roast effect".
Acircle
=
πr2
=
1
Asphere
4πr2
4
Clouds, snow cover, and dust in the atmosphere reflect some of the Sun's radiation. The albedo (α) of a a planet, moon, comet, or asteroid is the fraction of incident sunlight it reflects. (The English word albedo is derived from the Latin word albus meaning white.) For this problem, we care about the complement of that fraction. I'll call this the "albedo effect".
1 − α = 1 − 0.297 = 0.703
Combining "albedo effect" with the "rotisserie effect" gives us the time averaged fraction of the Sun's irradiance absorbed over the whole Earth.
Use the Stefan-Boltzmann equation to compute the expected temperature of the Earth from the effective irradiance of the Sun.
P = EA = εσA(T4 − T04)
The background temperature (T0) of the universe is so close to 0 K that it might as well be zero. (The actual value is 2.725 K.) The bare surface of the Earth without any atmosphere or clouds or ice or snow is very nearly a black body, so ε ≈ 1. Algebra makes the area disappear from the equation.
E = σT4
Solve, substitute, compute.
T4expected =
Eeffective
σ
T4expected =
240 W/m2
5.67 × 10⁻⁸ W/m2K4
Texpected =
255 K = −18 °C
Chilly, to say the least. For the sake of life as we know it, the Earth needs an atmosphere.
Start with the Stefan-Boltzmann equation.
P = EA = εσA(T4 − T04)
Once again use the effective irradiance, assume outer space is at absolute zero, and eliminate area with algebra — but this time assume the Earth is not nearly a black body, so ε ≠ 1.
E = εσT4
Solve for emissivity, substitute, and compute.
εeffective =
Eeffective
σT4actual
εeffective =
240 W/m2
(5.67 × 10⁻⁸ W/m2K4)(288 K)4
εeffective =
0.613
The solution to the previous part of this problem suggests we should be living on a snowball earth. The reason we don't is because the Earth's atmosphere temporarily detains the escaping infrared radiation. Keeping this energy around for a little while heats things up a little bit. Although the Earth's surface is a black body in the infrared, its atmosphere is a bit "gray" at these same wavelengths.
practice problem 4
vostok.txt Snow rarely gets a chance to melt in Antarctica, even in the summer when the sun never sets. In the interior of the continent, the temperature of the air hasn't been above the freezing point of water in any significant way for the last 900,000 years. The snow that falls there accumulates and accumulates and accumulates until it compresses into rock solid ice — up to 4.5 km thick in some regions. Since the snow that falls is originally fluffy with air, the ice that eventually forms still holds remnants of this air — very, very old air. By examining the isotopic composition of the gases in carefully extracted ice cores we can learn things about the climate of the past. By extension we might also be able to predict some things about the climate of the future.
Columns
Age of air (years before present)
Temperature anomaly with respect to the mean recent time value (°C)
Construct a set of overlapping time series graphs for CO2concentration and temperature anomaly.
Construct a scatter plot of temperature anomaly vs. CO2concentration.
How are atmospheric carbon dioxide concentration and temperature anomaly related?
What temperature anomaly might one expect given current atmospheric CO2levels?
Dust
Construct a set of overlapping time series graphs for dust and temperature anomaly.
Construct a scatter plot of temperature anomaly vs. dust concentration.
How are atmospheric dust concentration and temperature anomaly related?
What global average temperature anomaly might one expect from exceptionally high levels of atmospheric dust?
solution
CO2
Here are the overlapping time series graphs. The data show a definite correlation. The two quantities go up and down in near synchrony.
Here's the scatter plot of the two time-varying quantities plotted against one another. The data forms a dense cloud that is roughly oval shaped. The best fit line slices nicely through the data.
Temperature varies linearly with atmospheric carbon dioxide concentration. Low CO2levels go with a cooler climate and high CO2levels go with a warmer climate.
What does our linear regression analysis predict given current carbon dioxide levels of about 400 ppm?
y = mx + b y = (0.0908 °C/ppm)(400 ppm) − 25.23 °C y = +11 °C
The current consensus among working climate scientists is that the globe will warm +5 °C on average over the course of the 21st century. The increase is expected to be smaller than average near the equator and greater than average near the poles. Since the Vostok ice cores were collected in Antarctica, our prediction of approximately +10 °C is right in line with those made by more sophisticated means.
Correlation is not causation, however. Graphs like those used in this problem cannot tell us whether carbon dioxide affects temperature, temperature affects carbon dioxide, or some third factor is affecting both. We need a theoretical model that describes which way the cause and effect work. That model is described in more detail in the section of this book that deals with heat transfer by radiation.
Carbon dioxide is a greenhouse gas. Its role in atmospheric thermodynamics is much like the glass in a greenhouse. It is transparent to visible light, but not to infrared. Visible light easily punches through the atmosphere. It is absorbed by the ground and then reradiated as infrared. The infrared is partly blocked by the atmosphere and has a hard time escaping out into space. This little delay keeps the Earth comfortably warm. Water vapor, carbon dioxide, methane, and other gases have been shown to play a significant role in this process. They all interact with infrared radiation. These properties have been measured in tabletop laboratory experiments that had no direct connection to climatology.
Atmospheric carbon dioxide levels have increased steadily over the past 100 to 150 years. This is due to the burning of coal, petroleum, and natural gas as well as deforestation and other changes in land use associated with the Industrial Revolution. During this same time period, average global temperatures have been generally increasing and there is no reason to believe that this trend will quit anytime soon. Climate models all show that as long as CO2concentrations stay somewhere around their turn of the 21st century levels, global temperatures will continue to increase for the next 100 years. This conclusion is based on solid scientific reasoning and is regarded by nearly all climate scientists as valid. The scientific questions that remain unanswered are: how can we increase the precision and reliability of our global climate predictions and what effect will the inevitable changes have on life as we know it? The question of what is to be done about this is is a political, not scientific, question.
Dust
Here are the overlapping time series graphs. The correlation with temperature is not as evident for dust as it was for CO2 since the changes are in the opposite direction. High levels of dust seem to correlate with low temperatures.
The relation between dust and temperature becomes more evident when graphed as a scatter plot. It appears that temperature decreases with increasing dust, but this decrease levels off after a while. The relationship appears to have a horizontal asymptote like an exponential approach function.
Atmospheric dust correlates to a negative temperature anomaly that exponentially approaches a minimum value.
As dust concentration increases, the exponential term of our curve fitting function approaches zero leaving the constant term to stand by itself. This is the limit or asymptote of our curve fit.
y =
ae−bx − c
ymin =
− c = −7.6 °C
So what is going on here? Does dust cause temperatures to drop or do low temperatures make the dust fly? The answer to this question is not so simple. Here we have a real problem of determining causation.
Water vapor, carbon dioxide, methane, and the other greenhouse gases absorb and reradiate infrared radiation because the natural vibrational frequencies of these molecules lie in the infrared part of the electromagnetic spectrum. They don't vibrate at visible light frequencies, which is why they are all transparent to the light that we see with our eyes.
Dust particles are large compared to molecules. They are also larger than a wavelength of infrared or visible light. Because of this, they are essentially obstacles to infrared and visible light waves. When the sky is full of dust, light has a hard time making it down to the ground. The dust particles scatter a great deal of solar energy back into space and the Earth is a little bit cooler as a result. Large volcanoes can spread so much dust into the atmosphere that they sometimes have a measurable effect on climate. The 1991 eruption of Mount Pinatubo in the Philippines caused a globally averaged temperature anomaly of −0.3 °C that lasted two years.
Well actually, that last statement isn't quite right. Mount Pinatubo did spread a lot of ash around the globe (resulting in fantastic sunsets), but the primary mechanism by which it cooled the Earth was through the injection of sulfur dioxide into the stratosphere. When SO2gets together with H2O the result is an aerosol of H2SO4— sulfuric acid. Aerosols have a greater cooling effect on climate than dust. (They are also notoriously hard to describe in climate models.)
Now let's examine the reverse causation. A cool climate is a dry one. When temperatures are low, water has a hard time evaporating. Less water vapor means less rain. Less rain means more dust. Maybe dust levels are high when the climate is cool is because a cool climate leads to more dust. If that's the case, then the last part of this problem may not be a question that can be answered with this data set.
If dust causes cooling, then the coldest dust could ever make the Earth would be around −8 °C lower than it is now. If cooling causes dust, then all we can say is that there has never been a temperature anomaly lower than −8 °C in the last 400,000 years and every time the Earth has gotten this cold it's been very dusty.