Physics A: Problem Set 2: Line of best fit
recommended reading
| High Marks: | n/a |
| Barron's Let's Review: | 1.6 Graphing data, 1.7 Direct and inverse proportion |
| physics.info: | Guidelines for hand drawn graphs, Sample hand drawn graph, Blank graph paper |
| Wikipedia: | n/a |
| HyperPhysics: | n/a |
| Khan Academy: | Estimating the line of best fit |
classwork
- electric-energy.txt
In the United States, electric energy is measured in kilowatt hours and purchased with dollars. This data set came from 12 months of electric bills for a New York City apartment in the early years of the 21st century.- Plot a graph of cost vs. energy consumed and determine the equation of the best fit straight line.
- Explain the significance of the coefficients m and b.
homework
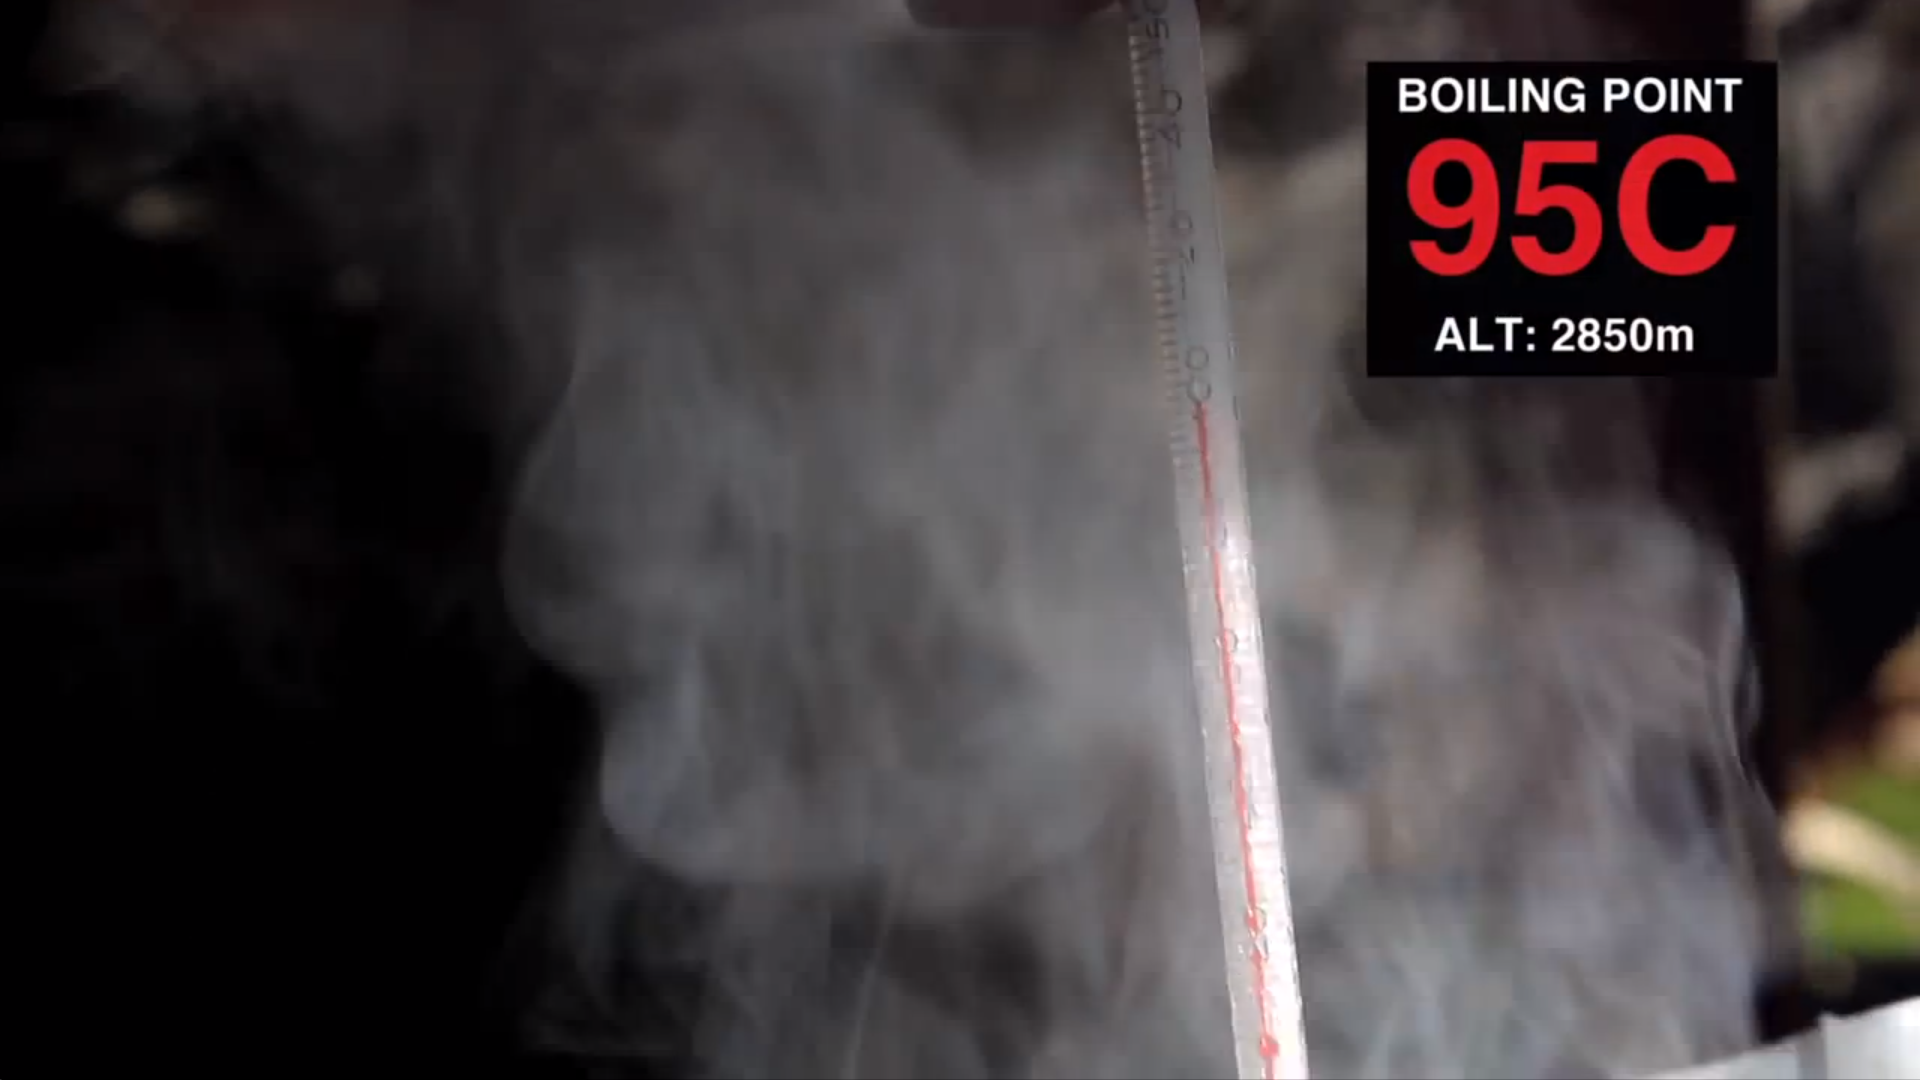
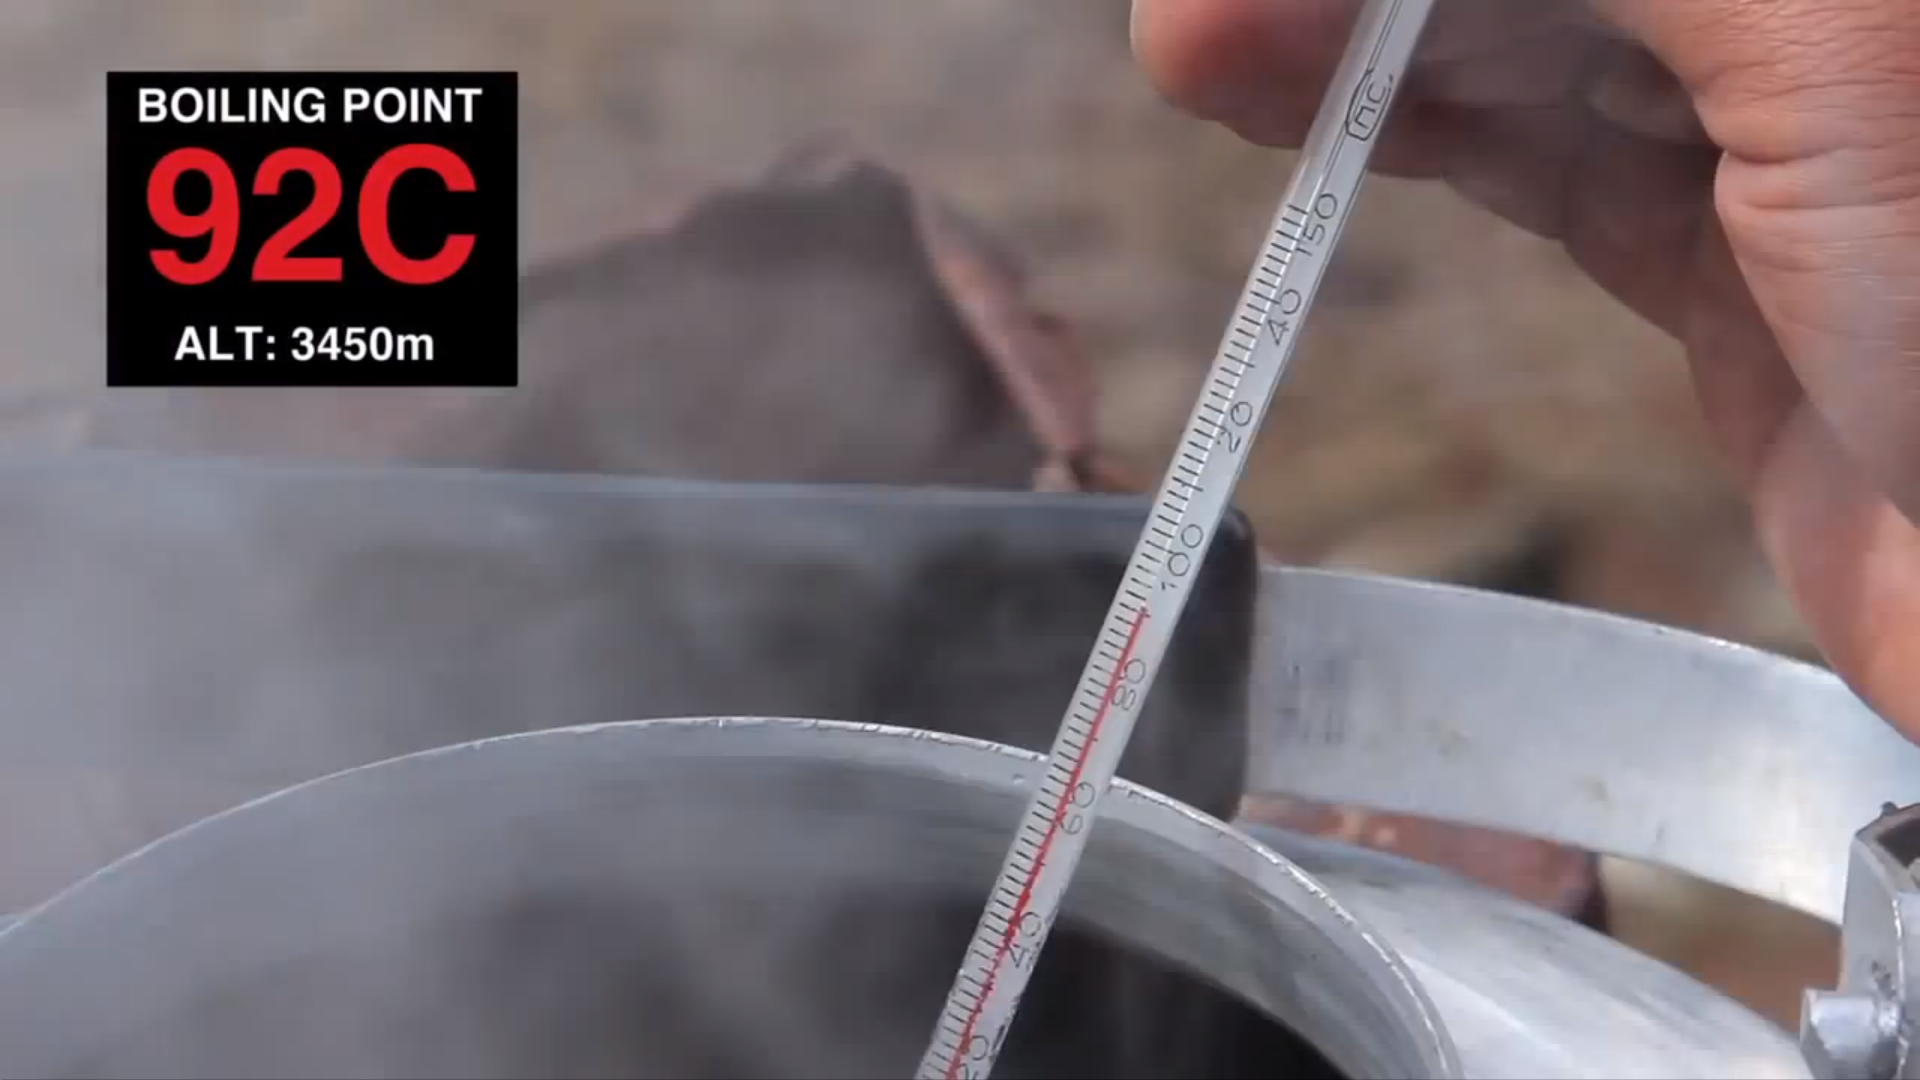
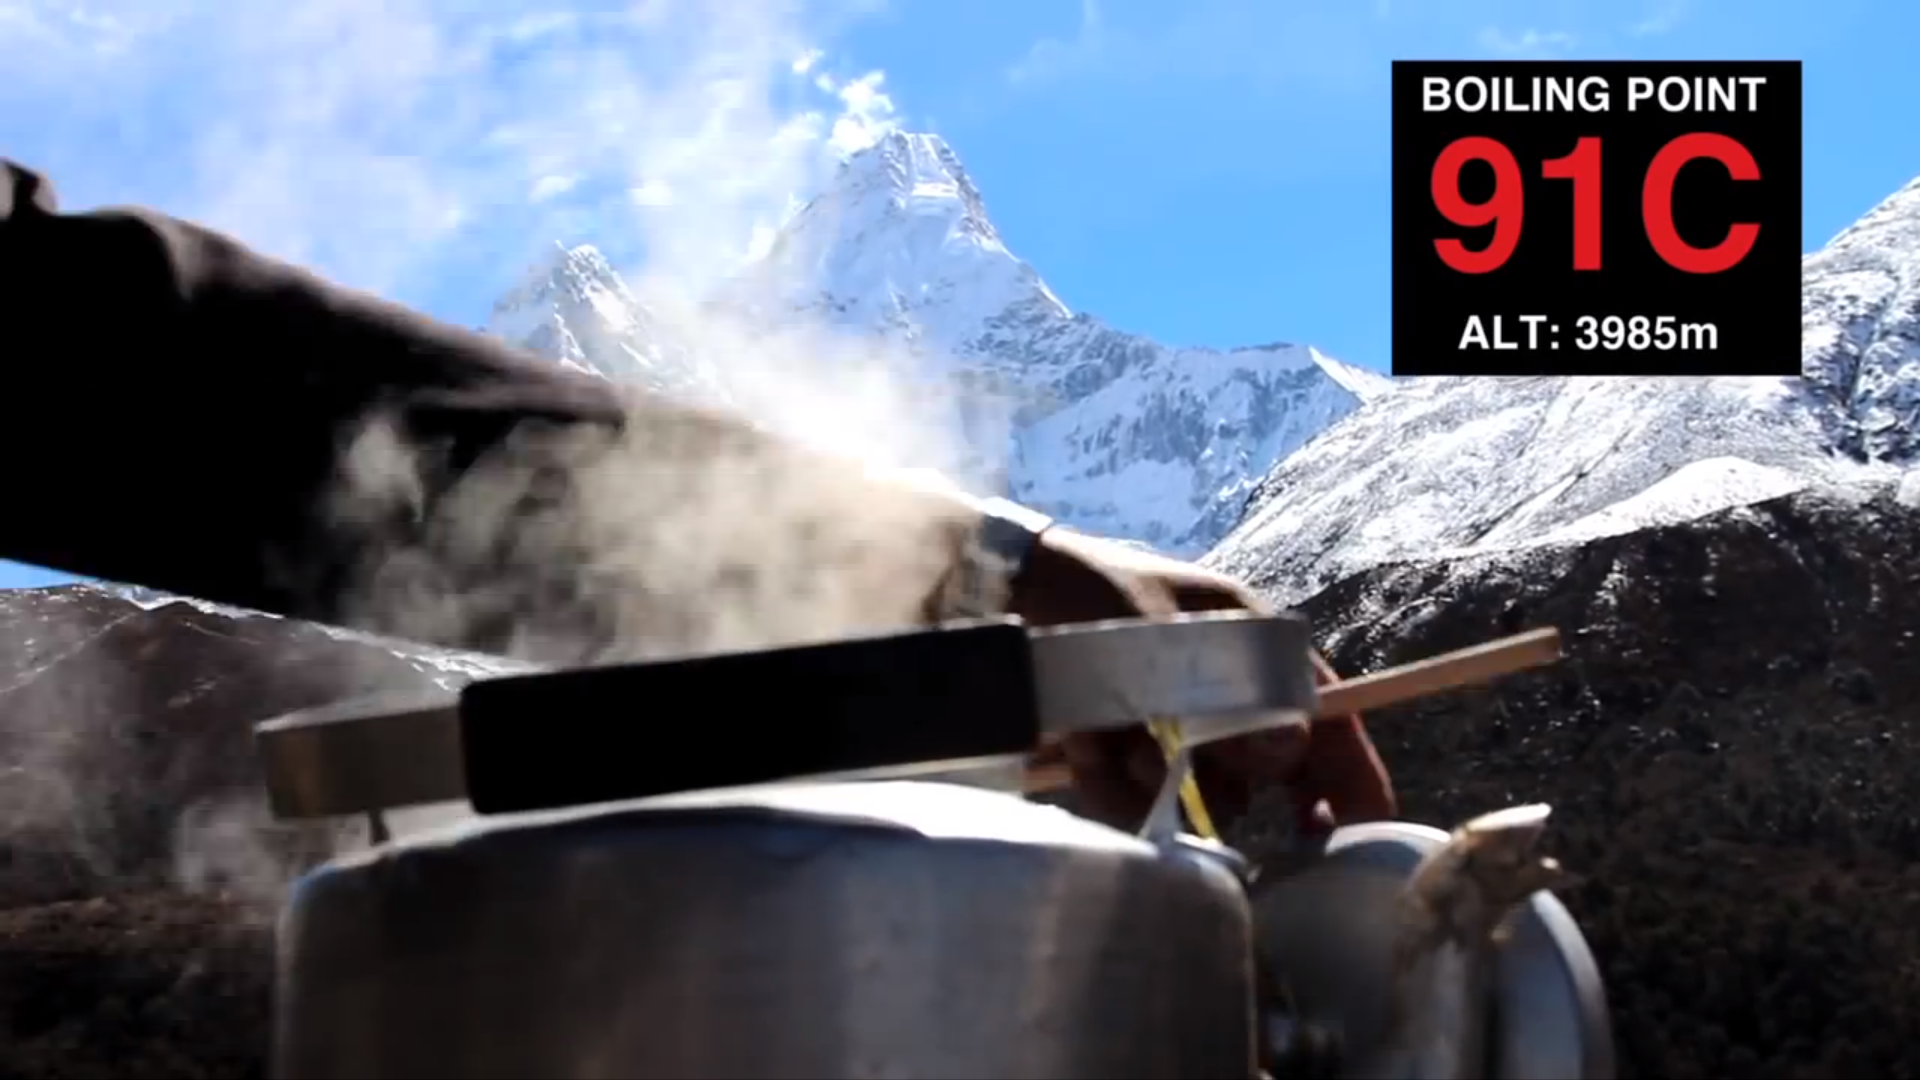
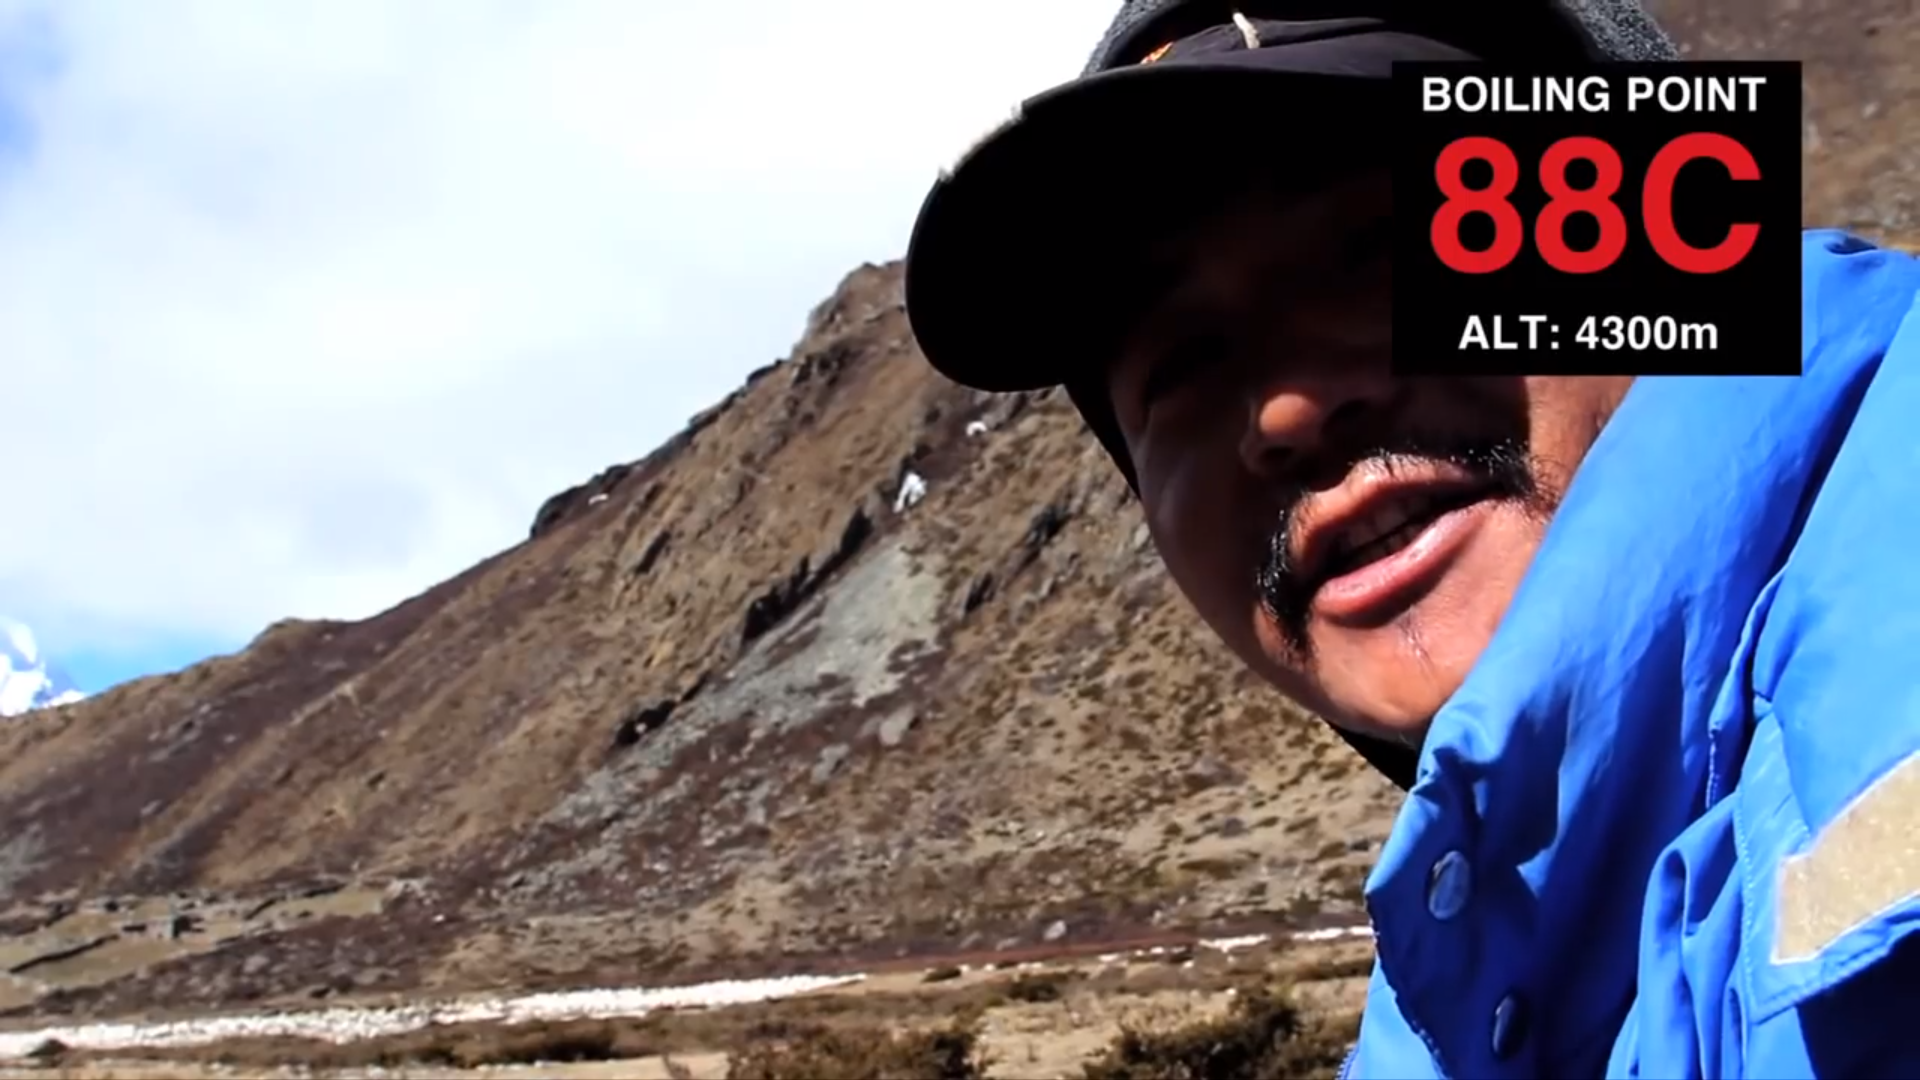
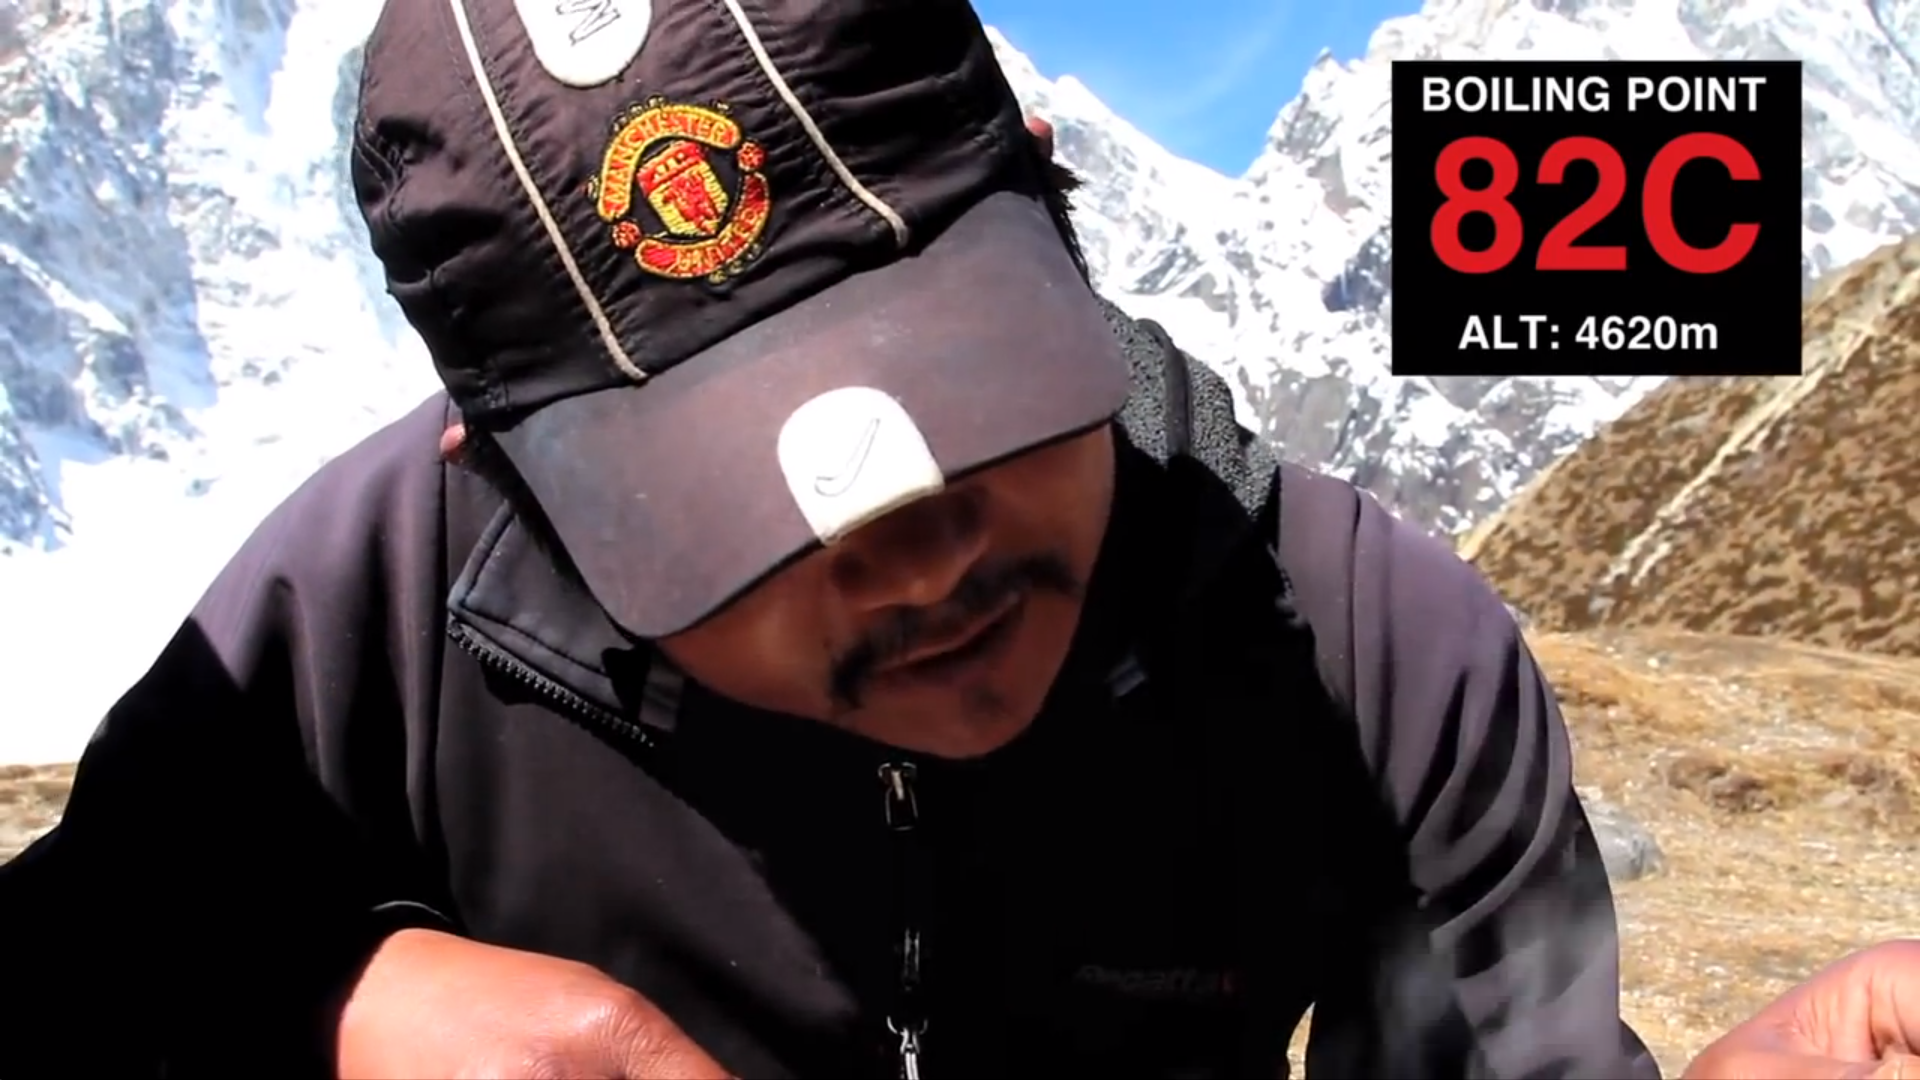
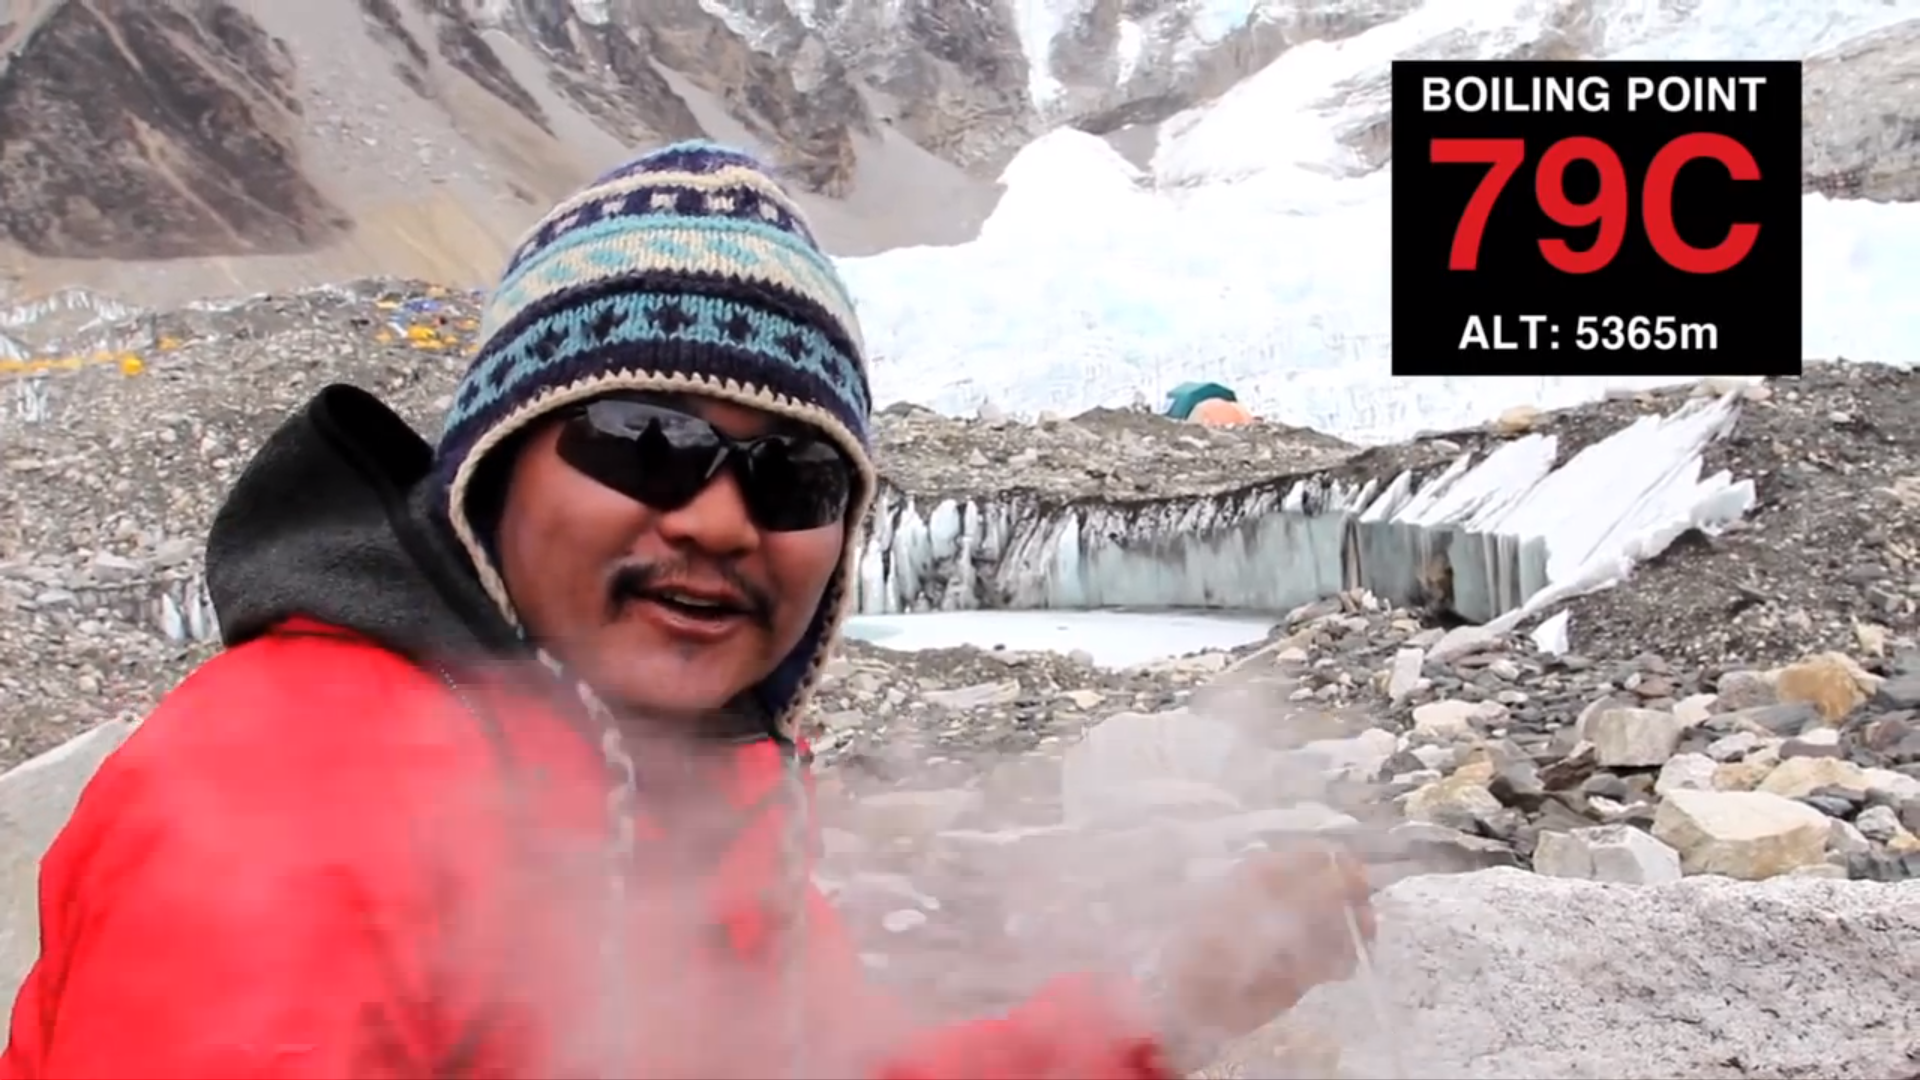
- Brady Haran is a video journalist best known for his YouTube video channels Periodic Videos, Numberphile, and Sixty Symbols. In May 2013 Haran released a video of his journey from Lukla, Nepal to the Base Camp for Mount Everest. Along the way, he and his guides Buddhi Rai and Chandra Rai measured the altitude and boiling point of water as they approached the the world's tallest mountain.


- Compile a table of altitude and boiling point from Buddhi's reported values.
- Draw a scatter plot of boiling point vs. altitude. Follow the guidelines for hand drawn graphs. Add a line of best fit and determine its slope (m) and y-intercept (b).
- Explain the significance of the coefficients m, b, and r2.