A six pack of tablet computers cost $250. What would two dozen of these devices cost?
Four landscapers can lay 8 meters of brick sidewalk in 6 hours. How long would it take one landscaper to do the job alone?
The floor of a 3 meter by 3 meter private office is covered by 100 tiles. How many tiles are needed for a 12 meter by 12 meter shared office?
The density of water is 1,000 kilograms per cubic meter. What is the density of a cup of water?
A student takes 10 minutes to walk from home to school at her normal pace. If she runs twice as fast as she normally walks, how long does it take her to run from home to school?
Twelfth grade students consume twice as much food during lunch as do first graders. A class of 12 first graders consume 6,000 calories. How many calories does a class of 24 twelfth graders consume?
Two students watch an instructional video together. The video lasts 12 minutes. How long does the video last if three students watch it?
A pump at a filling station delivers 12 liters of gasoline for $18. How much gas can be bought from this same pump with $6?
A single prep cook needs 1 hour to peel 120 carrots. How many prep cooks would it take to peel 240 carrots in 20 minutes?
A physics student gets a grade of 80% on the first quiz of the semester and 85% on the second quiz. What grade does the student get on the third quiz?
simple-pendulum.txt In this experiment, simple pendulums of different lengths were constructed and their periods measured. This data set looks linear, but is it really? What effect does length have on the period of a simple pendulum?
vostok.txt Snow rarely gets a chance to melt in Antarctica, even in the summer when the sun never sets. In the interior of the continent, the temperature of the air hasn't been above the freezing point of water in any significant way for the last 900,000 years. The snow that falls there accumulates and accumulates and accumulates until it compresses into rock solid ice — up to 4.5 km thick in some regions. Since the snow that falls is originally fluffy with air, the ice that eventually forms still holds remnants of this air — very, very old air. By examining the isotopic composition of the gases in carefully extracted ice cores we can learn things about the climate of the past. By extension we might also be able to predict some things about the climate of the future.
Columns
Age of air (years before present)
Temperature anomaly with respect to the mean recent time value (°C)
Construct a set of overlapping time series graphs for CO2concentration and temperature anomaly.
Construct a scatter plot of temperature anomaly vs. CO2concentration.
How are atmospheric carbon dioxide concentration and temperature anomaly related?
What temperature anomaly might one expect given current atmospheric CO2levels?
Dust
Construct a set of overlapping time series graphs for dust and temperature anomaly.
Construct a scatter plot of temperature anomaly vs. dust concentration.
How are atmospheric dust concentration and temperature anomaly related?
What global average temperature anomaly might one expect from exceptionally high levels of atmospheric dust?
pizza.txt An internet search engine was queried for pizzerias in the area centered on Brooklyn College. The name, phone number, and address were recorded for the first six hits. How is the building number of a pizzeria in Brooklyn affected by the last four digits of its phone number?
numerical
Rate, ratio, proportion
The recipe below makes a 20 cm by 20 cm pan of cornbread. You need to scale this recipe up for a commercial kitchen that needs to make a 1 m by 1 m square sheet. How much of each ingredient is needed?
180 g all purpose flour
150 g yellow cornmeal
10 g baking powder
1 g baking soda
4 g table salt
200 g light brown sugar
90 g frozen corn
2 large eggs
110 g unsalted butter
240 mL buttermilk
Who would cut a pizza into 5 slices? No one, that's who. You pick up a pizza cutter and cut diagonally across the pie (unless you live in the Midwest where circular pizzas are frequently cut tavern-style, but that's a problem for another day). Two cuts gives you 4 slices, three cuts 6 slices, four cuts 8 slices. All cleanly separated.
A 5-slice pizza requires five radial slices. Five cuts gives you 5 slices. Not very efficient. Plus, you have to start cutting from the center out. Try using a pizza wheel and doing that with any precision. Half the time you're cutting short, which results in incomplete vertices, and half the time you're cutting long, which results in split vertices. It's essential that the vertex on a pizza slice be sharp. Anything less is disrespectful to the pie.
So why then do some frozen pizzas sold in the US say that there are 5 servings per pie on their Nutrition Facts labels? They sometimes even say to cut a square pizza into fifths, which sounds like an unsolved problem of Euclidean geometry (like squaring the circle or trisecting an angle).
Given the Nutrition Facts label below, which came from a frozen pizza sold in the US, convert all the nutrition values for a 5-slice pizza to the more reasonable values for a…
4-slice pizza
6-slice pizza
The pizza in question is a bit too small to be divided into 8 slices, but for large pizzas that is a sensible option. This one was 10 inches, or 25 centimeters, in diameter — your basic medium.
Deep Dish Cheese Pizza net wt. 25 oz. (1.56 lbs.)
Nutrition Facts
4
servings per container
Serving size
1/4
pizza
(
g)
Amount per serving
Calories
% Daily Value*
Total Fat
000
g
%
Saturated Fat
g
%
Trans Fat
g
Cholesterol
mg
%
Sodium
mg
%
Total Carbohydrate
g
%
Dietary Fiber
g
%
Total Sugars
g
Includes
g Added Sugars
%
Protein
g
Vitamin D
mcg
%
Calcium
mg
%
Iron
mg
%
Potassium
mg
%
*
The % Daily Value (DV) tells you how much a nutrient in a serving of food contributes to a daily diet. 2,000 calories a day is used for general nutrition advice.
Nutrition Facts
5
servings per container
Serving size
1/5
pizza
(
142
g)
Amount per serving
Calories
340
% Daily Value*
Total Fat
19
g
24
%
Saturated Fat
8
g
40
%
Trans Fat
0
g
Cholesterol
40
mg
13
%
Sodium
470
mg
20
%
Total Carbohydrate
30
g
11
%
Dietary Fiber
0
g
0
%
Total Sugars
4
g
Includes
0
g Added Sugars
0
%
Protein
13
g
Vitamin D
0
mcg
0
%
Calcium
320
mg
25
%
Iron
2.1
mg
10
%
Potassium
0
mg
0
%
*
The % Daily Value (DV) tells you how much a nutrient in a serving of food contributes to a daily diet. 2,000 calories a day is used for general nutrition advice.
Nutrition Facts
6
servings per container
Serving size
1/6
pizza
(
g)
Amount per serving
Calories
% Daily Value*
Total Fat
000
g
%
Saturated Fat
g
%
Trans Fat
g
Cholesterol
mg
%
Sodium
mg
%
Total Carbohydrate
g
%
Dietary Fiber
g
%
Total Sugars
g
Includes
g Added Sugars
%
Protein
g
Vitamin D
mcg
%
Calcium
mg
%
Iron
mg
%
Potassium
mg
%
*
The % Daily Value (DV) tells you how much a nutrient in a serving of food contributes to a daily diet. 2,000 calories a day is used for general nutrition advice.
statistical
Two-column data sets
aerodynamic-drag.txt In this experiment students measured the aerodynamic drag on a weighted party balloon falling at different speeds. How does speed affect aerodynamic drag?
circular-motion.txt In this experiment a mass on the end of a string under constant tension was swung in a horizontal circle. What is the relationship between the speed of the mass and the radius of the string when the centripetal force is constant?
constant-force.txt In this experiment different masses were subject to the same force and their accelerations recorded. What effect does mass have on acceleration when force is constant?
falling-bodies.txt In this experiment different masses were dropped and their accelerations recorded. What effect does mass have on the acceleration due to gravity?
hubble-law.txt The data gathered in this classic 20th century scientific paper show the relation between the distance to several nearby galaxies and their radial velocities (that is, the component of their velocities away from the Milky Way). What is the relation between these two quantities and what does it say about the universe as a whole? This observation was described in 1929 by the American astronomer Edwin Hubble (1889–1953) and is now known as Hubble's law. Source: A relation between distance and radial velocity among extra-galactic nebulae. Edwin Hubble. Proceedings of the National Academy of Sciences. Vol. 15 No. 3 (1929): 168–173.
milk-freshness.txt The following data were taken from a milk carton sold in North Carolina. How is shelf life affected by storage temperature? Source: Greenler, Robert. Chasing the Rainbow. Milwaukee, WI: Elton-Wolf, 2000: 140.
moore-law.txt This data set shows the number of switches in a computer for various years in
the 20th century. How has the processing capacity of computers changed with time? This relationship, in a slightly modified form, was first described byGordon Moore(1929–0000), the founder of Intel, in 1964 and is now known as Moore's law. Source: IBM Gallery of Science & Art, 590 Madison Avenue, Second Floor, New York, NY 10022 (July 1992).
resonance-tube.txt In this experiment various tuning forks of known frequency were held above a resonance tube, which was used to determine the wavelength of the sound emitted. How does frequency affect wavelength?
dimmer-switch.txt In this experiment, a student placed a light meter 30 cm away from of a light bulb attached to a dimmer switch. How does the voltage delivered to a light bulb by a dimmer switch affect its illuminance? (Illuminance is related to brightness. In simple terms, illuminance is objective while brightness is subjective.)
balloons.txt James Glaisher was a 19th century English astronomer and meteorologist that is most famous for piloting a series of record setting balloon flights in the 1860s. One of his primary scientific objectives was to "determine the rate of decrease of temperature with increase of elevation". Given the data in the accompanying text file, what is this mathematical relationship? adapted from On scientific experiments in balloons. James Glaisher. Proceedings of the Royal Institution of Great Britain. Vol. 4 (1865): 385–398.
foot-on-the-gas.txt Does the price of gasoline affect the way Americans buy cars? Of course it does. Why else would I ask you? The real question is, how are gasoline prices and consumer auto purchases related? Columns:
Model year
Average gasoline price per gallon (inflation-adjusted 1993 dollars)
Average engine power of cars in each model year (horsepower)
Average fuel economy of cars in model year (miles per gallon)
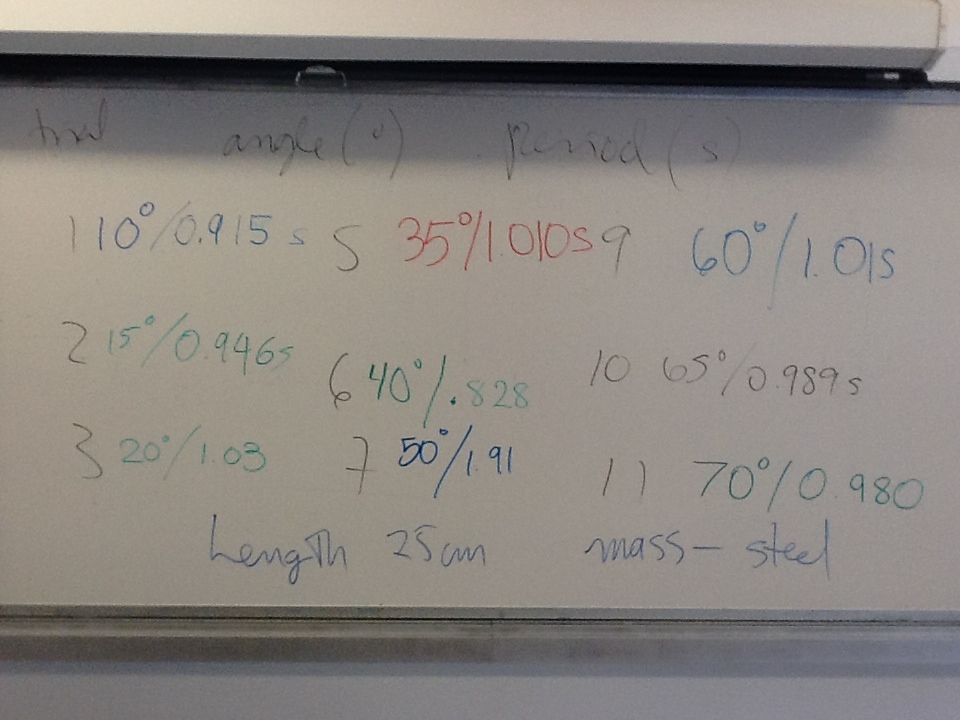
In this experiment, a class of physics students constructed simple pendulums with different masses, angles of release, and lengths and measured their periods. The results were compiled on the whiteboards at the front of the class. Use this raw data to determine the effect of mass, angle of release, and length on the period of a simple pendulum.
Various masses
Various angles
Various lengths
Multi-column data sets
computer-temperatures.txt Some computers are equipped with temperatures sensors that monitor various components and activate fans. How does temperature evolve in the parts of a computer after it has been turned on? Columns:
Running time (minutes)
CPU A Die (°C)
CPU B Die (°C)
Memory Controller Heatsink (°C)
Drive Bay (°C)
"Smart Disk" Hard Drive (°C)
dulong-petit-law.txt How does specific heat vary with atomic mass? This relationship was first described in 1819 by the French physicists Pierre Louis Dulong (1785–1838) and Aléxis Thérèse Petit (1791–1820) and is now known as the Dulong-Petit law. Columns:
Element name
Atomic mass (atomic mass units)
Specific heat capacity (J/kg K)
Source: CRC Handbook of Chemistry and Physics. 75th Edition. Boca Raton, FL: CRC Press, 1995.
solar-observations.txt Heinrich Schwabe (1789–1875) was a 19th century astronomer searching for a planet nearer to the Sun than Mercury. He never found this inframercurial planet, but his long term observations of sunspots lead to an important discovery. What was it? Columns:
x-rays.txt X-rays can be produced by bombarding stationary atoms with a beam of fast moving electrons. The energy of the emerging x-rays peaks around several values, two of which are included in the accompanying text file. x-rays with these peak values are called characteristic x-rays since they can be used to identify elements. How are energy and atomic number related for characteristic x-rays? Columns:
Two-column data sets that require some sort of transformation
free-fall.txt In this experiment, the displacement of a falling object was recorded every sixtieth of a second using a device called a ticker timer. Convert the time units from sixtieths of a second to seconds and then determine the relationship between distance and time during free fall.
inertia.txt In this experiment, the displacement of a cart moving in the absence of a net external force was recorded every sixtieth of a second using a device called a ticker timer. Convert the time units from sixtieths of a second to seconds and then determine the relationship between distance and time in the absence of a net external force.
spherical-lens.txt In this experiment, the in-focus image distance was determined for an object placed at various distances in front of a magnifying glass. The important quantity for optometrists, however, is the reciprocal of distance in meters — a quantity called vergence. Calculate the vergences and then determine the relationship between image vergence and object vergence. (The unit of vergence is the diopter which is equal to an inverse meter [D = m−1].)
subway-fares.txt The first line of what would become the New York City subway opened on 27 October 1904. The fare then was only a nickel (5¢ or $0.05). The most recent increase was on 20 August 2023 when the fare was raised from $2.75 to $2.90. Assuming that past fare prices can be used to predict future ones, use the data in this text file to…
predict a likely fare for the New York City subway on the January after its…
125th anniversary (January 2030)
150th anniversary (January 2055)
200th anniversary (January 2105)
predict the year when the January price of a ride on the New York City subway is likely to first be greater than…
$5
$20
$100
Multi-column data sets that require some sort of transformation
kepler-law.txt This data set shows the mean orbital radius (in astronomical units) and orbital period (in days or years) of each of the nine planets. Convert the radii to meters, convert the periods to seconds, and then determine the relationship between radius and period. This relationship was discovered in 1619 by the German mathematician Johannes Kepler (1571–1630) and is now known as Kepler's third law of planetary motion. He came to this conclusion 18 years after receiving the data. Given the tools of contemporary analysis, which Kepler did not have access to, you should be able to arrive at a conclusion in under five minutes. Columns:
Planet name
Mean orbital radius in astronomical units (a unit equal to the Earth's orbital radius)
Orbital period (Note the change in units between the inner and outer planets.)
Source: CRC Handbook of Chemistry and Physics. 75th Edition. Boca Raton, FL: CRC Press, 1995.
track-events.txt This file gives the world record times for eight track events.
climate-and-geography.txt What effect does latitude have on average yearly temperature? Before you attempt this question you must compensate for the variation in altitude of the different data points. Temperature decreases 6.5 °C for every 1,000 m of altitude. Calculate the altitude adjusted temperature for the cities in this data set. If you have done this correctly you will see the correlation of the data set increase. Then perform a curve fit and answer the question. Columns:
City name
Latitude (degrees: positive-north, negative-south)